

In today’s data-driven world, the ability to present information in a visually appealing and easily digestible format is a highly sought-after skill. Businesses, marketers, and educators alike understand the power of effectively communicating complex data through visually engaging reports. This article will guide you through the process of creating stunning visual reports, focusing on the top tools available for this purpose.
Why Visual Reports?
Visual reports transform raw data into a form that is easier to understand and interpret. They allow businesses to convey complex information clearly, facilitating better decision-making. Visual reports can include everything from simple pie charts and bar graphs to multi-dimensional heat maps and interactive dashboards.
Some benefits of visual reports include:
- Enhanced data comprehension: Visual reports make it easier for people to understand large volumes of data quickly.
- Improved decision-making: By providing a clear view of trends and patterns, visual reports can help businesses make informed decisions.
- Increased engagement: Visually attractive reports are more likely to engage your audience compared to raw data or textual reports.
- Interactive dashboards and story points
- Data blending and real-time analysis
- Collaboration of resources
- Rich personalized dashboards
- Interactive visualizations with self-service analytics capabilities
- Seamless sharing and publishing of reports
- Associative data indexing
- Advanced collaboration tools
- Comprehensive data integration
- User-friendly editor
- Ability to animate objects and import data directly
- Easy sharing and embedding options
- Customizable and dynamic reporting
- Connection with multiple data sources
- Collaboration in real-time
Top Tools for Creating Visual Reports
Let’s explore some of the best tools available for creating stunning visual reports.
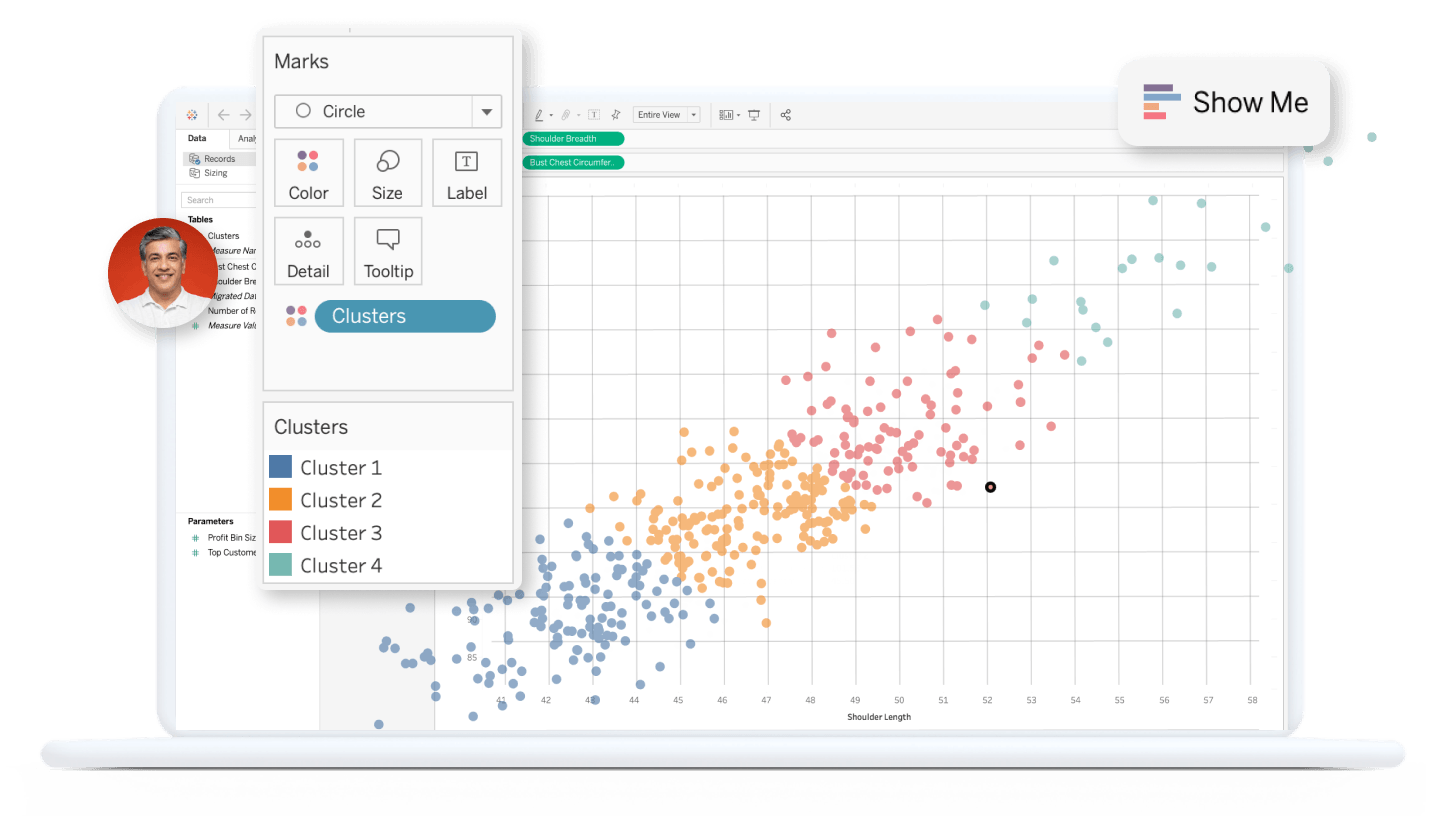
Tableau
Tableau is one of the most widely used data visualization tools in the business world. It allows you to create a variety of interactive visualizations and dashboards with a simple drag-and-drop interface. Tableau’s capabilities include:
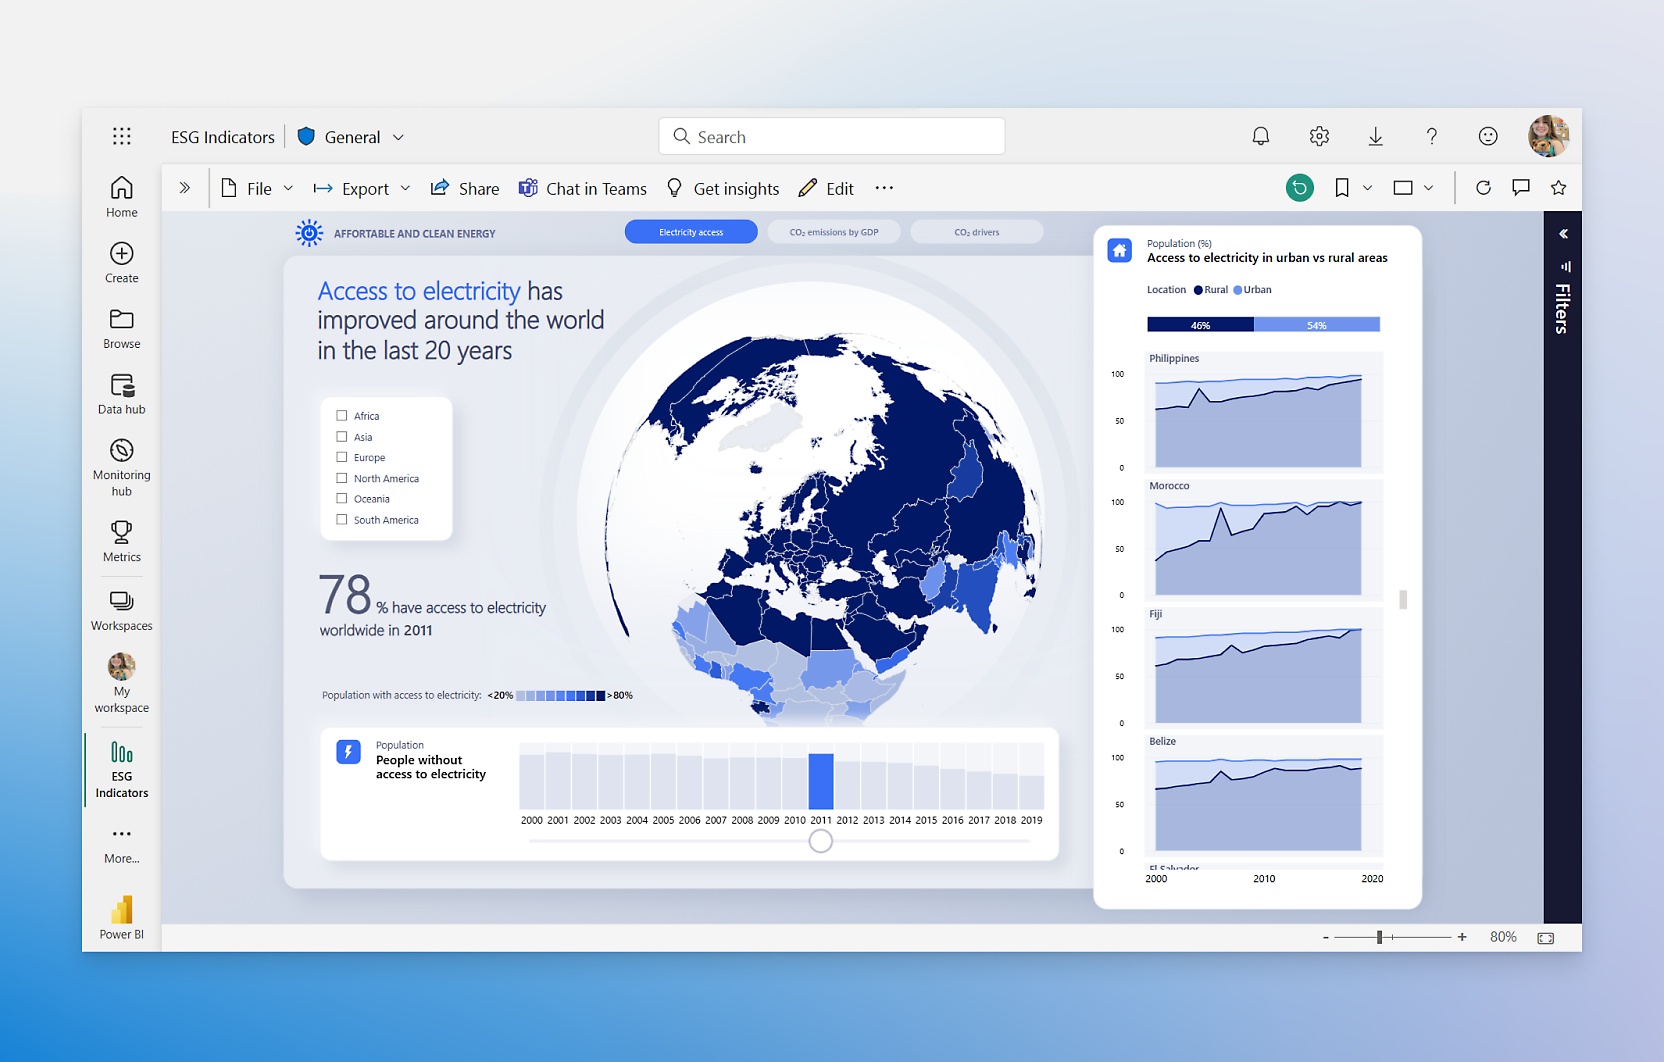
Power BI
Power BI, a product from Microsoft, offers robust data visualization capabilities. It can connect to multiple data sources, simplifying data prep, and drive ad hoc analysis. Key features include:
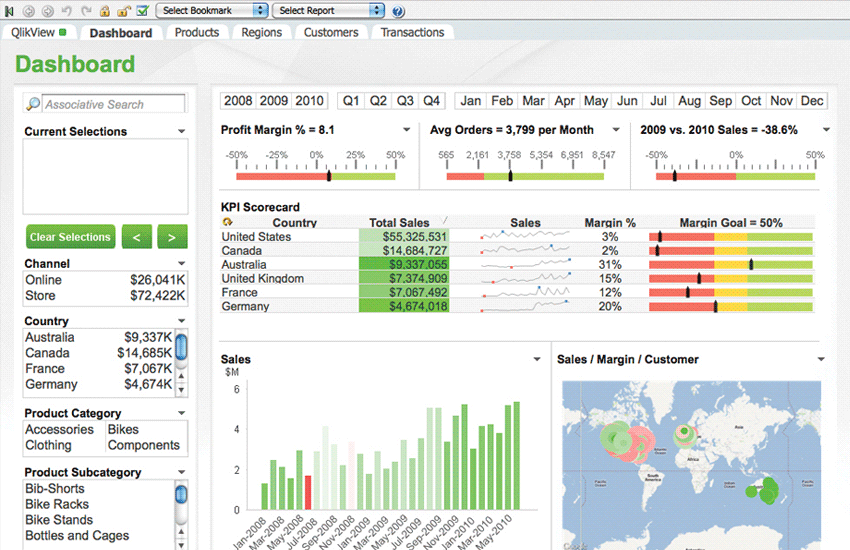
QlikView
QlikView is a business intelligence tool that offers guided analytics. It allows users to create custom visualizations, reports, and dashboards. Some of its features include:
Infogram
Infogram is a great tool for creating infographics, charts, and maps. It offers a wide variety of templates and customization options. Highlights of Infogram include:
Google Data Studio
Google Data Studio is a free tool that turns your data into informative, easy-to-read, and shareable reports. It supports data collection from a variety of sources. Its features include:
Conclusion
Visual reports are a powerful tool for communicating complex data in an engaging and understandable way. With the right tool, you can create stunning visual reports that can enhance your data comprehension, aid in decision-making, and increase audience engagement.
Whether you choose Tableau for its interactive dashboards, Power BI for its seamless data integration, or Google Data Studio for its cost-effectiveness, the key is to select the tool that best fits your data visualization needs. So, start exploring these tools and create stunning visual reports that can transform your data into actionable insights.
Call to Action: Want to learn more about visual reporting and data visualization? Subscribe to our newsletter for the latest tips, tutorials, and industry news.